Repo
Problem definition
We have anonymised data given by the company. However, the database is not very clean and the files are separated.
We have a work of data cleaning and aggregation to do.
Once this first step done, we would like to have a customer segmentation that can be easily maintained in the future.
The frequency of update needs to be determined by us.
We are in a basic Unsupervised Learning type of problem where we need to find features that will helps segment customers into actionable groups.
Our clients wants to be able to do group specific marketing towards them. We need to find clusters in our customer database. Hence, we expect
algorithms such as K-means or DBScan to play a major role in this process.
Data Cleaning and Aggregation
Cleaning
Our files have very common issues:
- - Some of the data is in portuguese
- - Unconsistent types in data entries (e.g string in float columns)
- - NaNs in some of the columns
However, these issues only represent a small proportion of our data
We solve these issues in the following way:
- - Translation of portuguese data
- - Unconsistent types are replaced with the correct colum types
- - NaNs are replaced with legal values
Aggregation
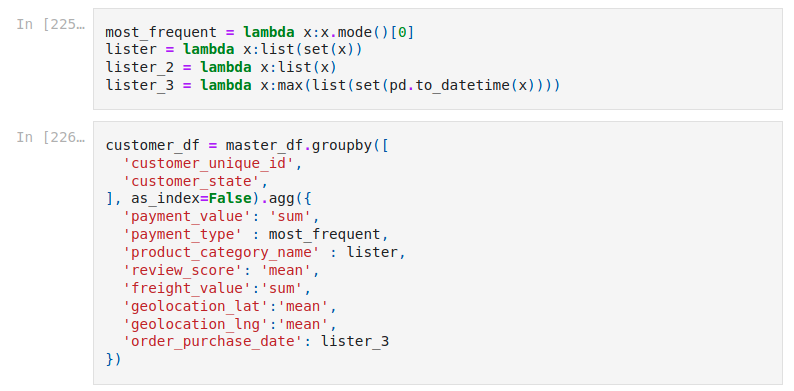
Once done, we aggregation our data files using customer_unique_id as index. Indeed, we would like to have datas that would represent some kind of customer behavior. We rely heavily on pandas merging methods to realize that aggregation and simplication of our database.
Exploratory Data Analysis
We invite the reader to focus on the code for more understanding about this section, but here the most interesting parts of our Analysis
Customer x State Analysis
In the two charts below, we would like to have an idea of customer purchasing power per state. Mean_Price would be a good enough proxy to evaluate purchasing power. We notice that Sao Paulo is the main reagion where the activity is coming (in terms of volume), but the usage of SP customers are more "commodity type" as highlighted by lower prices


Total orders and Timing
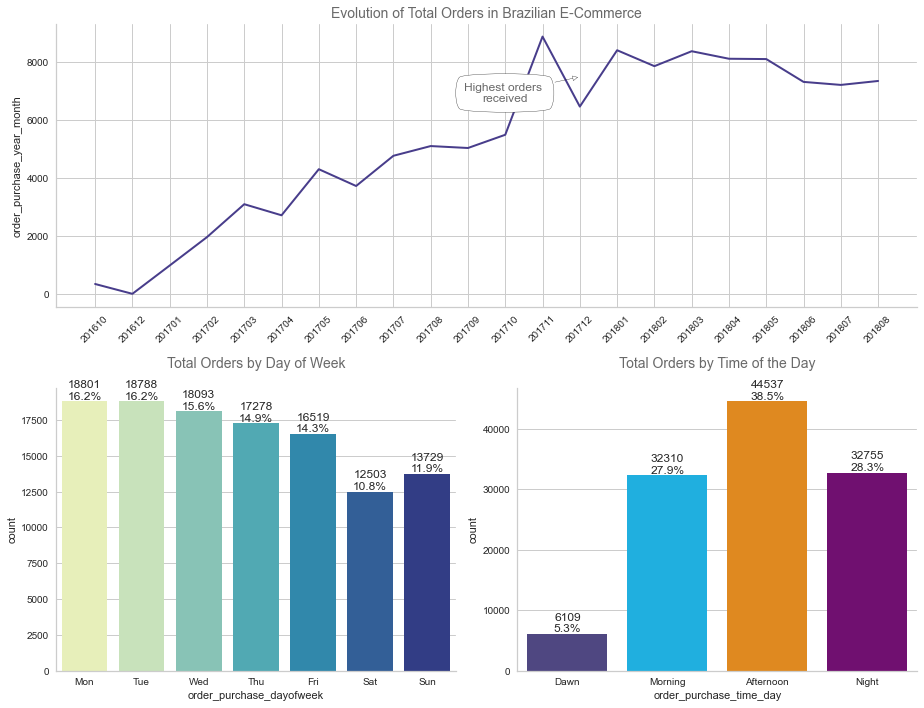
Our platform customer number has not stopped increasing since 2016. One can notice that the customers tend to order beginning of the week, and during the afternoon.
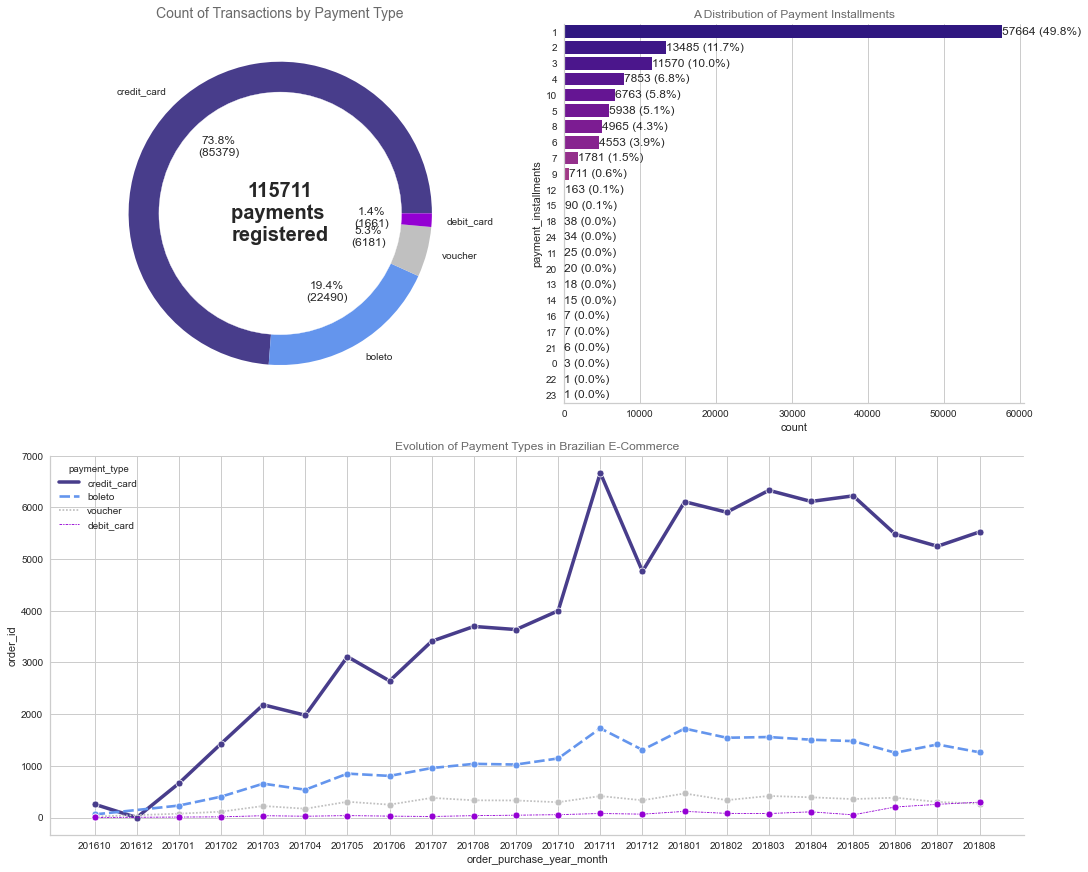
Credit cards are customers preferred payment methods and they tend to pay in low number of installments, which is good indicator of their credit quality
Payment Types
Heat Map
Customers are largely condensed in the urban areas of Brazil. Note that the country has a lot forest in the middle, hence making it complicated to have logistics in these areas

Feature Engineering
Further Data Transformation
PCA on product category
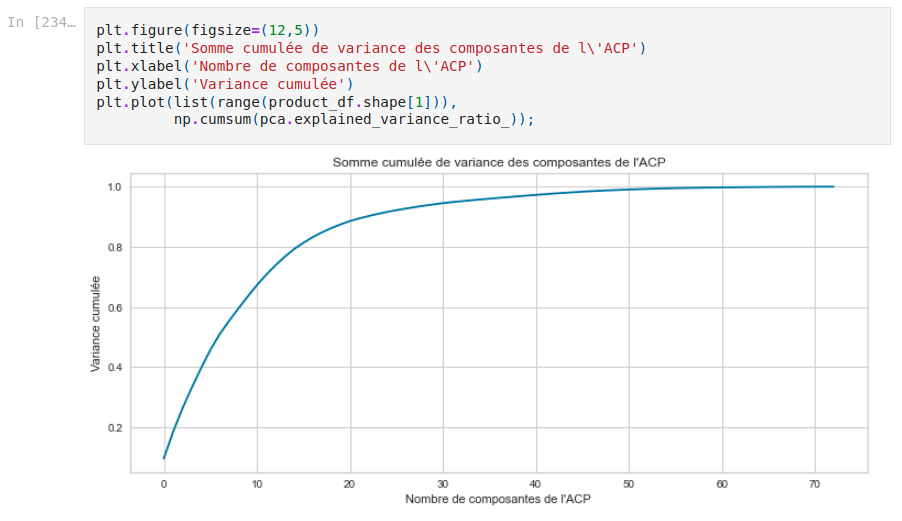
We decide to do a dimension reduction on product category. The chart below shows cumulated variance over eigenvalues, and we decide that we would like to keep 80% of variance, hence choosing [X] components seems appropriate. Notice the big difference, with the original number of categories.
Feature Scaling
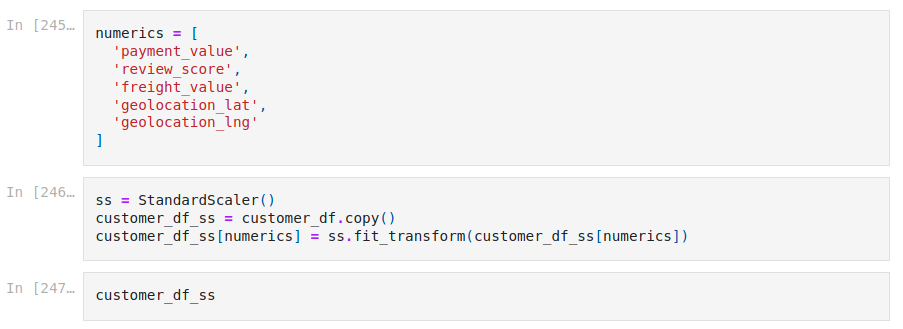
We are going to Standard Scale the numerical values in our dataset.
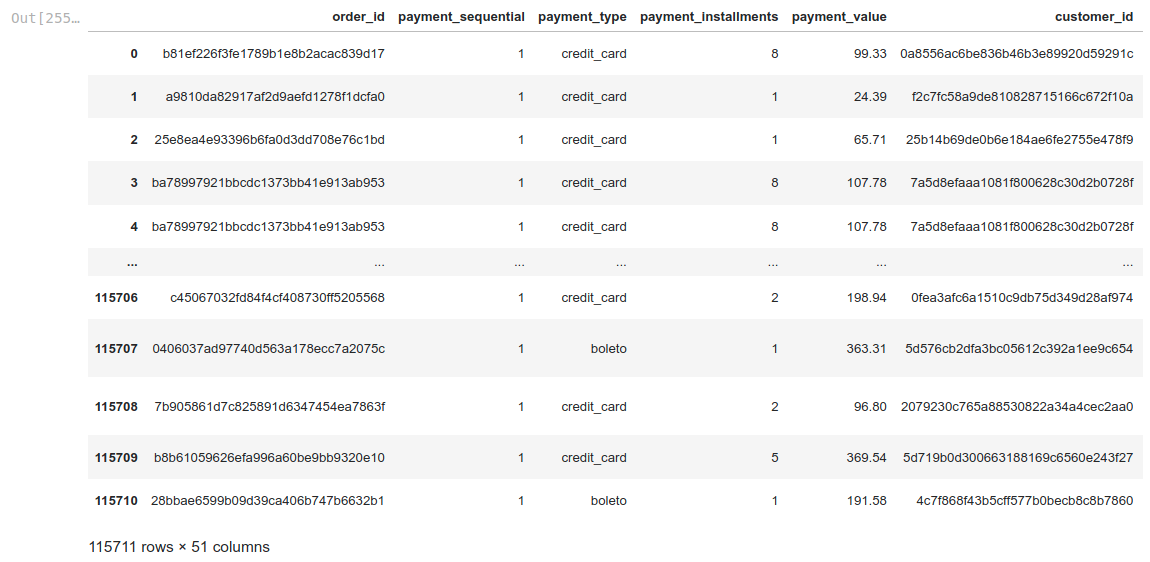
Below is an overview of our dataset after all the transformations we did previously. Time to do some Machine Learning !
Machine Learning Algorithms
We think that K-means and DBScan are good candidates for this dataset and datatype. However, we are dispappointed with the results from DBScan, hence we will not mention them in this case study. Check the repo for more details.
K-Means
We use the Yellowbrick package to tune the hyperparameters for our k-means, i.e. the number k which represents the number of clusters to be found
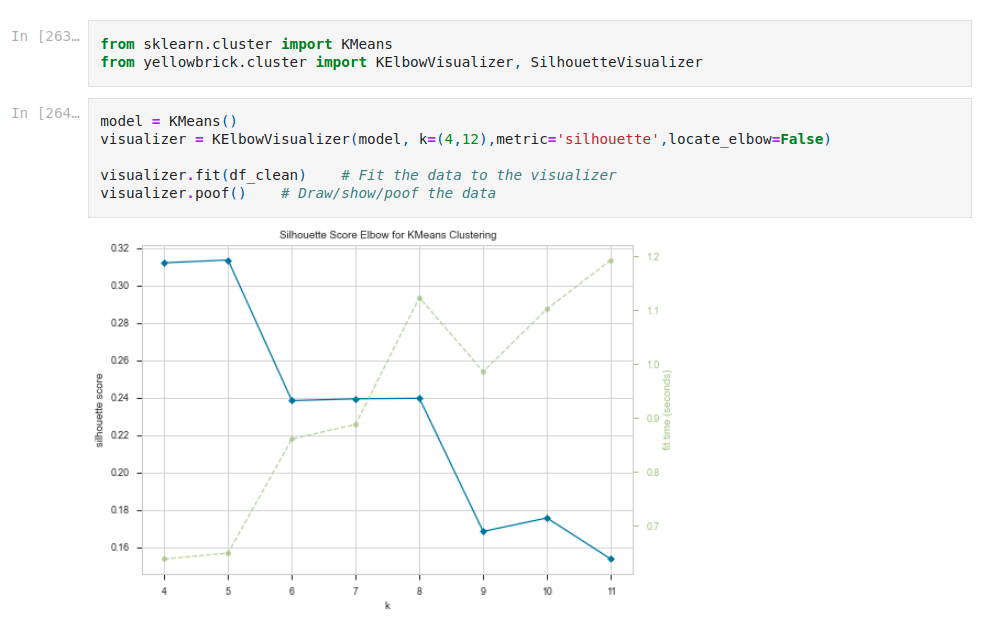
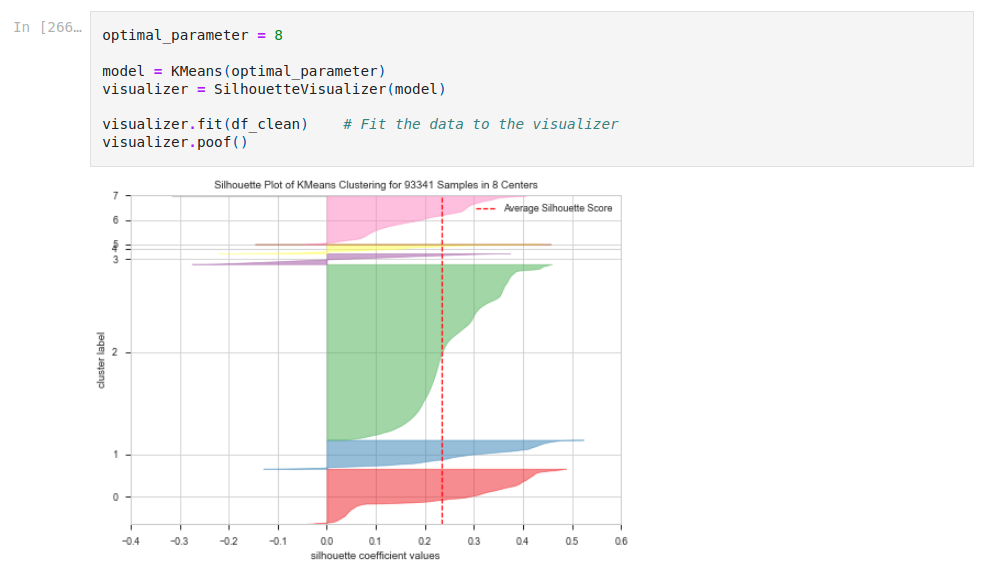
Chart below highlights the difference of size in the clusters obtained: one weighs roughly 50% of the customers, which puts the quality of our clustering to question
Cluster characteristics
We show the table below showing features per cluster groups. Our main takeaways are:
- Cluster 1: Happy customers with recurring use of the platform
- Cluster 2: Clients to be reconquered. Bad experience with platform.
- Cluster 0: Recurring customers. Happy users.
- Cluster 4: High purchasing power customers. Make them recurring.

Maintenance analysis
Look in the repo for implementation of that method, we the diagram below (which I am quite proud of!) represents our way of thinking about maintenance frequency for our business client. Other approaches are possible, but we used this one, just because we lacked time to implement another one !

